Business Reports
Transactions, Profit & Loss, Cashflow, Tax, VAT, supplier spending, and an evidence-based efficiency score — all in one hub.
Business Reports
Go to Business Reports (reached via Back to Dashboard from most finance screens). Reports are grouped into three sections: Financial Reports, Supplier & VAT Reports, and Analytics.
Transactions
Click Transactions to view every income and expenditure transaction in a date range, with a Start Date and End Date picker and Generate Report, Export For, and Export controls common to most reports in this hub.

Transactions — Summary cards, Income Breakdown by Type, Expense Breakdown by Category, and Supplier Analysis
The Summary shows Total Income, Total Expenses, and Net Position for the selected period. Below it, Income Breakdown by Type splits income into Cash, Card, and Voucher with transaction counts and totals; Expense Breakdown by Category and Supplier Analysis do the same from the expenditure side.
Profit & Loss
Click Profit & Loss for a proper P&L statement over a date range: Gross Income, Total Expenses, Net Profit, and Profit Margin as headline figures, followed by an Income Breakdown and Expense Breakdown each split out by type or category with Gross, VAT, and Net columns.

Profit & Loss — headline figures and a full income/expense breakdown with VAT split out
Cashflow
Click Cashflow for a forward-looking cash position. Set a date range and a number of Forecast Months Ahead, then Generate Forecast.

Cashflow — current position, forecast summary, and a month-by-month projection
Current Cash Position, Report Period, and Account sit at the top, followed by a Forecast Summary (Starting Balance, Projected Income, Projected Expenses, Ending Balance), a Monthly Cashflow Projections table, and a Detailed Monthly Breakdown card per forecast month.
Tax Report
Click Tax Report and select a Tax Year (a progress bar shows how far through the year you are). The report calculates Total Tax Due, Monthly Requirement, and National Insurance, with full Income Summary, Income Tax Breakdown by band, National Insurance Breakdown by class, and Payment Requirements.

Tax Report — full income tax and National Insurance breakdown, with a recommended monthly set-aside
| Figure | What it means |
|---|---|
| Taxable Income | Gross Income minus Total Expenses for the tax year |
| Monthly Set-aside Recommendation | Annual liability divided evenly across 12 months |
| Adjusted Monthly Requirement | The same liability divided across however many months remain in the tax year — higher if you're starting partway through |
VAT Returns
Clicking VAT Returns from this hub takes you straight to the Finance Dashboard's VAT tab, rather than opening a separate report here. See Finance Dashboard for VAT Monitoring, thresholds, and VAT Liabilities in full.
Aged Payables
Click Aged Payables for a cross-supplier view of everything you currently owe, broken into ageing bands. This report draws only from real unpaid bills, so it isn't affected by the Quick Start data issue described above.
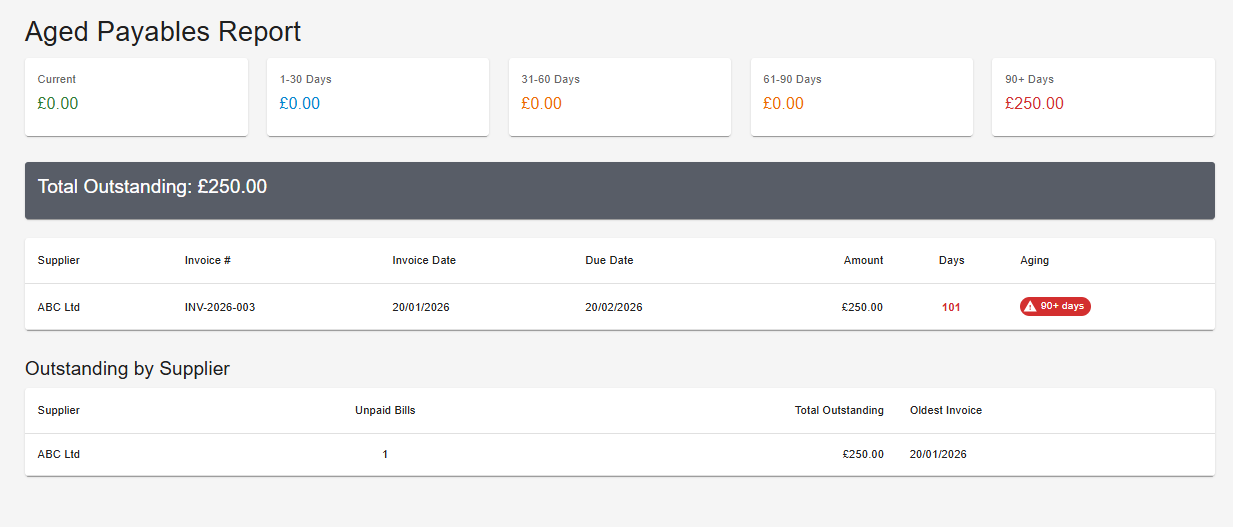
Aged Payables — outstanding totals by age band, individual unpaid invoices, and a per-supplier summary
Full detail on adding and paying bills is covered in Bills & Suppliers — this report is just the cross-supplier rollup of what's recorded there.
Supplier Spending
Click Supplier Spending for spending analytics across all suppliers, with a Time Range selector and three sub-tabs: Monthly Trends, Top Suppliers, and Category Breakdown.

Monthly Trends — spending by month as a bar chart and trend line, with Total, Average, and Peak Month summary cards

Top Suppliers — ranks every supplier (and Quick Start Setup, if undeleted) by total spend

Category Breakdown — a donut chart and list of every expenditure category by total
Efficiency Analyser
Click Efficiency Analyser for an evidence-based score built from your actual performance data — revenue per hour, client throughput, and average ticket value, each measured against a target. Choose an Analysis Period, then move through six tabs: Overview, Opportunities, Team Performance, Patterns, M&B Benchmark, and Scenario Builder.

Overview — an overall Efficiency Score out of 100, broken into Revenue Performance, Client Throughput, and Ticket Value
Score Breakdown
Three weighted components make up the overall score:
| Component | Weight |
|---|---|
| Revenue Performance | 40% |
| Client Throughput | 30% |
| Ticket Value | 30% |
Below the score, three cards show Revenue Per Hour, Clients Per Hour, and Average Ticket, each with a Current figure, a Target, and the gap between them as both an amount and a percentage.
Opportunities
The Opportunities tab lists "Your Top 3 Opportunities" with a combined annual potential value, each tagged by Impact (High/Medium/Low) and Effort (High/Medium/Low) required to capture it.

Top 3 Opportunities — ranked by combined annual potential, each tagged by impact and effort
A panel titled The Reality frames these opportunities as fully within the salon's own control — no VAT cut, government intervention, or external factor required — and notes the analysis is built from the account's actual employee income records, not industry averages.
Other tabs
Team Performance, Patterns, M&B Benchmark, and Scenario Builder haven't been walked through yet — these will be added once reviewed against the live screens.